
Close a session
Analytics on ungounded counts is a chart of guesses. Finish the walk first.
Bar analytics & pour cost
See real pour cost per drink, automatic variance analysis, demand forecasting, and AI-written daily briefs built on a clean count-to-sales reconciliation. Turn your beverage program into numbers you can manage.
14 days free · No credit card · Plans from $59/month
Last updated
Pour cost is liquor cost divided by beverage sales for the period you choose. ExactPour computes that from recipes, current bottle cost, and a physical count, then shows variance beside it. There is no universal target band for every room. Use your own numbers. The public calculator is on /pour-cost-calculator.
Analytics on ungounded counts is a chart of guesses. Finish the walk first.
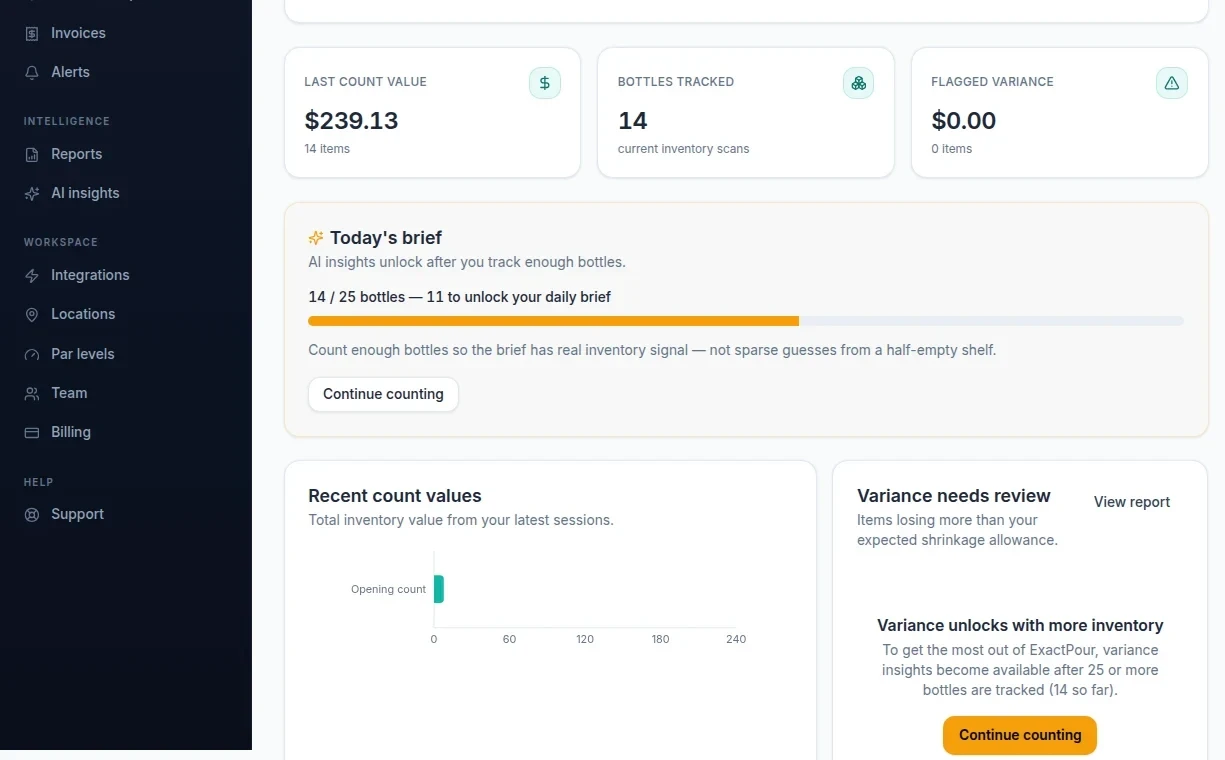
Pour cost, variance, and unexplained shrink from your recipes, tickets, and shelf.
Reports list variance, projected inventory, depletion, period comparison, and pour cost. Open them when you have data.
The problem
Without live recipes tied to current pricing, pour cost is a quarterly reconstruction nobody trusts. Pricing decisions become gut calls.
If you only review variance at month end, the trail is cold and the money is gone. You cannot coach staff on events nobody remembers.
Most analytics tools give you more charts, not more decisions. The insight that protects margin never reaches the floor in time.
The solution
Real pour cost, automatic variance, demand forecasting, and AI briefs, all built on reconciled data.
Know the cost of every drink.
Cost per serving is computed from live bottle pricing and recipe ounces, so you see pour cost and margin per menu item and can price with confidence.
Surface the gaps. Explain them.
Items that drift beyond tolerance are flagged (>10% warning, >5% info). Close each out with a reason (breakage, theft, over-pour, measurement error) and notes.
Underpriced drinks, flagged.
Pour-cost math flags underpriced drinks against your target band, suggests a new price, and shows the monthly margin impact at current volume. The numbers come from your recipes and sales; AI only writes the summary.
Savings you can verify, not vibes.
When ExactPour flags a loss and your team fixes it, the scoreboard measures the before-and-after loss rate from your own counts and reports a verified dollar figure for what you recovered. No estimates, no AI guesswork.
See run-out dates before they happen.
Projects future usage per product from 90 days of POS sales, projected per-day usage, an estimated run-out date, and a confidence rating.
Ask questions. Get answers from your data.
Ask in plain English: "What is my biggest variance issue this month?" Answered using only your real numbers, with starter prompts to guide you.
Integrates with the POS you already run
Sales sync nightly · No rip and replace




Reports you run after a count
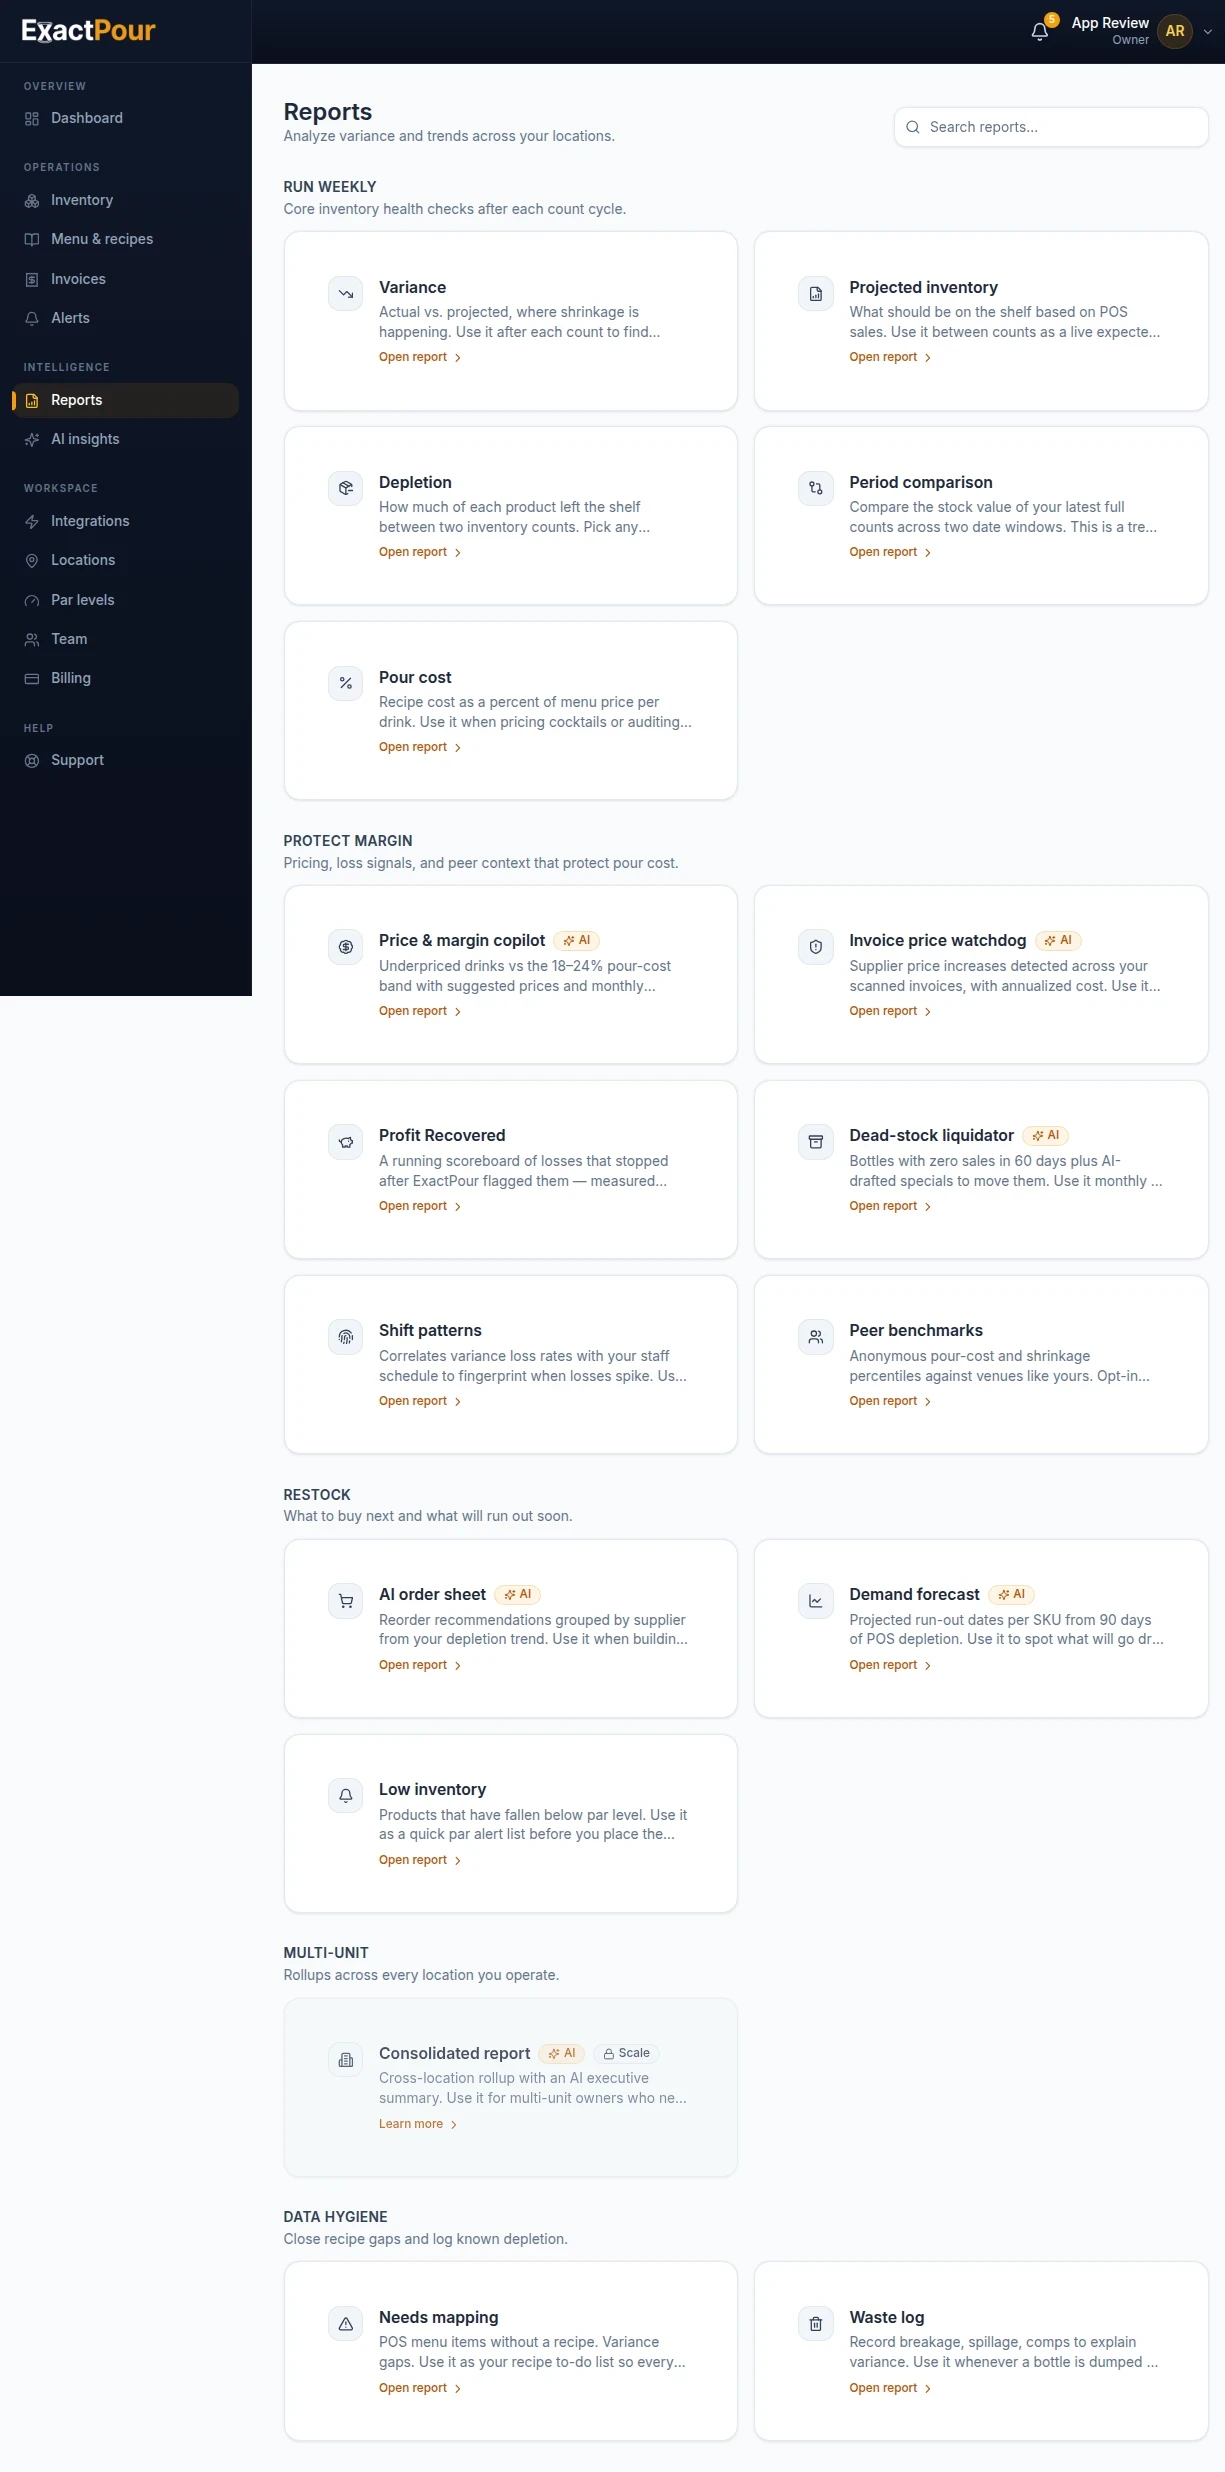
Variance, projected inventory, depletion, period comparison, and pour cost as a navigation index. Not a filled empty report.
Compare
| Capability | ExactPour | Spreadsheets & clipboards |
|---|---|---|
| Full liquor count | Minutes, by barcode | Hours, hand-tallied |
| Partial-bottle accuracy | Rounded guesses | |
| POS sales reconciliation | Automatic | |
| Variance flagged automatically | ||
| True pour cost per drink | Manual formulas | |
| AI briefs, forecasts & anomaly alerts | ||
| Multi-location roll-up | Separate files | |
| Immutable audit trail |
See real pour cost per drink, category, and location
Get variance flagged automatically, not at month end
Forecast run-out dates and order with confidence
Open your phone to an AI brief of what to act on today
Ask plain-language questions and get answers from your data
Bar analytics is the practice of turning your beverage program into numbers you can manage. At its simplest, that means knowing your pour cost, variance, and shrinkage at any moment instead of at month end. At its best, it means forecasting demand, detecting anomalies the moment they appear, and getting plain-English answers to questions like which product lost the most money last month, without building a single report.
ExactPour treats bar analytics as the output of a clean counting and reconciliation engine. Recipes tie each drink to its ingredients and cost. POS sales drive projected inventory. Your physical count closes the loop and exposes variance. And an AI layer on top of all that data writes daily briefs, forecasts demand, and flags anomalies so you spend less time in spreadsheets and more time on the floor.
Analytics without a trustworthy count is theater. ExactPour refuses to pretend a dashboard alone is the product; the product is reconciled data you can defend in a manager meeting. That is why barcode counting and POS sync are part of the analytics story, not a separate module you ignore until reporting day.
Pour cost is the percentage of revenue spent on the liquor in each drink. If a cocktail sells for $14 and the liquor in it costs $2.10, the pour cost is 15%. Use that formula with your own pricing and product mix rather than relying on an uncited universal target.
Pour cost is only as reliable as the inventory behind it, however. If your counts are guesses and your bottle prices are stale, your pour cost is fiction. ExactPour computes pour cost from live recipes tied to current supplier pricing (kept current by invoice OCR) and reconciled against real usage, so you see pour cost by category, by product, by drink, and by location, and you can watch it move as you change specs, prices, or vendors.
ExactPour also helps operators separate recipe pour cost from realized pour cost. Recipe pour cost is what the spec says should happen; realized cost incorporates actual usage after reconciliation. When those diverge, you have a portioning or process story, not just a pricing story. That distinction is the heart of pour cost software that changes behavior.
Variance is the gap between what your POS says you sold (projected usage) and what your physical count says is missing (actual usage). Shrinkage is the portion you cannot explain with a reason code such as breakage, spillage, or comps. Measure it from your own records instead of applying an unsupported industry percentage.
ExactPour flags every product that drifts beyond tolerance automatically and lets you reconcile each exception with a reason code. Over a few cycles, patterns emerge: a specific well spirit that always runs short, a shift that consistently loses more product, a high-theft SKU that needs to move. That pattern recognition is what turns a number into a story you can act on, and it is the foundation of every other metric in your program.
Dollarize the gap. ExactPour helps operators value variance using bottle costs so a meeting is not about abstract ounces alone. A small percentage on a high-value SKU can matter more than a larger percentage on a cheap well. Bar analytics that cannot rank exceptions by dollars wastes manager time on the wrong shelf.
Ordering is where accurate bar analytics turns directly into working capital you get to keep. ExactPour runs regression on recent POS depletion per product and outputs projected usage, a horizon total, an estimated run-out date, and a confidence rating. You see which products are burning through, which are gathering dust, and when to reorder, so you stop tying up cash in slow movers and never run short on the products that drive revenue.
Because par levels can be tuned by location and by season, the system adapts to how your bar actually sells. A rooftop program can carry heavier on rose and canned cocktails in July, while a whiskey bar builds depth in brown spirits for the winter, and the order suggestions adjust to match. That is pour cost and demand analytics turned into smarter purchasing.
Forecasts are only as good as the sales history behind them. ExactPour's POS connectors for Toast, Square, Clover, and GoTab keep depletion grounded in tickets rather than memory. When a menu change lands, rebuild the recipe map so forecasting follows the new build, not the old one that no longer rings.
The hardest part of bar analytics is separating a normal bad night from a real problem worth investigating. ExactPour's AI layer scans recent variance per product, computes a per-product baseline, and flags outliers relative to that product's own history. That is statistical anomaly detection applied to your beverage program, and it runs so outliers do not sit unread for weeks.
On top of that, ExactPour auto-generates prioritized, plain-English insights from recent variance, sales, and counts. You open your phone to a brief that tells you what to act on, ranked by severity, instead of digging through dashboards. Scheduled AI monitoring runs anomaly sweeps and digests so a multi-location operator can manage a portfolio from one login.
The conversational assistant answers questions using your real numbers, not invented benchmarks. Ask which location's pour cost widened this week or which products drove unexplained variance, and ExactPour responds from reconciled data. That is analytics as a workflow, not as a chart gallery.
The right bar analytics software does not stop at reporting. It reconciles your counts against your POS automatically, computes real pour cost from current pricing, flags variance without you building a query, forecasts demand, and answers plain-language questions about your data. The best platforms layer AI on top so you get actionable briefs instead of more dashboards nobody reads.
ExactPour was built to do all of the above for bars, nightclubs, restaurants, and hospitality groups. It starts free for a single location, includes the full AI layer on Pro, and scales across venues on higher plans. If your bar analytics have been a quarterly exercise in reconstructing a number nobody trusts, that changes the day you switch to weekly reconciled data.
Judge vendors on whether they can show pour cost, variance, and a brief from a real count-plus-POS loop. ExactPour is designed for that demo. Pair this page with bar inventory software when you need the counting foundation, and with calculators when you want calculators that make the formulas tangible before you buy.
Analytics only pay off when they change decisions. ExactPour supports a simple weekly pour-cost review: pull pour cost by drink and category, list the widest variance flags, and pick one pricing change, one recipe change, or one coaching action. Cap the meeting so it cannot expand into a two-hour debate that never reaches the floor.
Bring evidence, not vibes. ExactPour's recipe costs, invoice-updated bottle prices, and reconciled usage give managers a shared packet. If a cocktail's pour cost rose because the base spirit's invoice price moved, the action is pricing or spec, not a lecture about "pouring less" with no number attached. If realized usage exceeds recipe theory, the action is portioning and comps discipline.
Close the loop the following week. ExactPour's history shows whether the change moved pour cost or variance in the intended direction. That is how bar analytics becomes a management system: hypothesis, change, measure. Without ExactPour closing counts and POS sync each cycle, the meeting collapses back into anecdotes.
Blended beverage cost can hide a category problem. ExactPour lets operators view pour cost and variance by category so a tidy overall number does not conceal a spirits leak or a wine-by-the-glass miss. Spirits usually need the tightest bottle-level control; wine may need vintage and bottle-size discipline; beer and RTDs often need velocity and waste tracking more than free-pour theory.
ExactPour's product and recipe model supports that mix. Map draft and packaged beer carefully so POS items deplete the right keg or SKU. Treat RTDs as countable units with barcodes. Keep wine glasses tied to bottle yields you believe. Category analytics fail when the recipe map is sloppy, ExactPour makes the map visible so you know where theory is incomplete.
Use category views to prioritize labor. If spirits variance dollars dominate, spend manager time on the back bar before auditing the cooler. ExactPour's dollarized flags help that triage. Bar analytics should allocate attention the way a good GM allocates labor: to the largest controllable loss first.
Portfolio analytics are worthless when each venue counts differently. ExactPour standardizes the inputs, barcode counts, fill levels, POS sync, reason codes, so pour cost and variance can be compared across locations. Owners can see which room is the outlier and whether the issue is pricing, product mix, or unexplained usage.
Permissions matter. ExactPour supports location-scoped access so a bartender counts one room while an area manager reads the roll-up. AI digests on higher plans can summarize portfolio anomalies without forcing leadership to open every venue's dashboard manually. That is how bar analytics scales past a single operator's nights-and-weekends capacity.
When locations run different POS systems, ExactPour still consolidates the inventory analytics layer. Toast, Square, Clover, and GoTab can each feed their venue while ExactPour keeps the definitions of pour cost and variance consistent. For inventory software selection across the group, see bar inventory software; for formula-level planning aids, see calculators.
A practical ExactPour analytics stack has four layers. Layer one is capture: barcode counts and invoice costs. Layer two is reconciliation: POS sales mapped to recipes. Layer three is metrics: pour cost, variance, shrinkage, and forecasts. Layer four is action: AI briefs, anomaly flags, and the weekly review meeting. Skip a layer and the stack collapses into vanity charts.
ExactPour is opinionated about that order on purpose. Many tools sell layer-four storytelling without layer-one truth. ExactPour invests in the count and the POS loop so the stories are about your room. Operators can measure whether the stack is working by a simple test: can a manager name this week's top variance dollars and the action taken without opening a spreadsheet?
Illustrative example with made-up round numbers: a venue with $10,000 in weekly beverage sales and a 2% unexplained variance gap is looking at $200 of unexplained product at selling-price framing, or a different dollar figure when valued at cost. ExactPour helps you compute the cost-valued gap from your counts; the point of the example is the method, not a promise that every bar will see the same number. Analytics earn trust when the math is yours.
FAQ
Divide liquor cost by beverage sales. Example: $2,000 of liquor cost on $10,000 of beverage sales is 20%. The cost side needs current bottle prices and a real count. ExactPour does that math after you count and sync the POS. See how to calculate pour cost.
There is no honest universal target. Concept, well mix, and pricing change the number. Measure your own recipe pour cost and actual pour cost, then manage the gap. ExactPour will not assign a band to every venue.
Pour cost is a ratio of cost to sales. Shrinkage is the unexplained leftover after you compare projected usage to the count and code the honest loss. Both need the same finished count.
No. Public research pages state formulas and method. They do not invent a national average for your room.
Pour cost and variance flagging are on Starter at $59 a month and up, and during the 14-day trial. See pricing.
Use pour cost calculator for planning math. Use this page when you want the software that keeps the number honest after a count.
Next step
Start your 14-day Pro trial. No credit card required.
Start tonight
Run ExactPour on your own bar for two weeks. See the leaks, the over-pours, and the dollars you can still save.
14 days free · No credit card · From $59/mo