
Guides
How to calculate pour cost from current inventory data
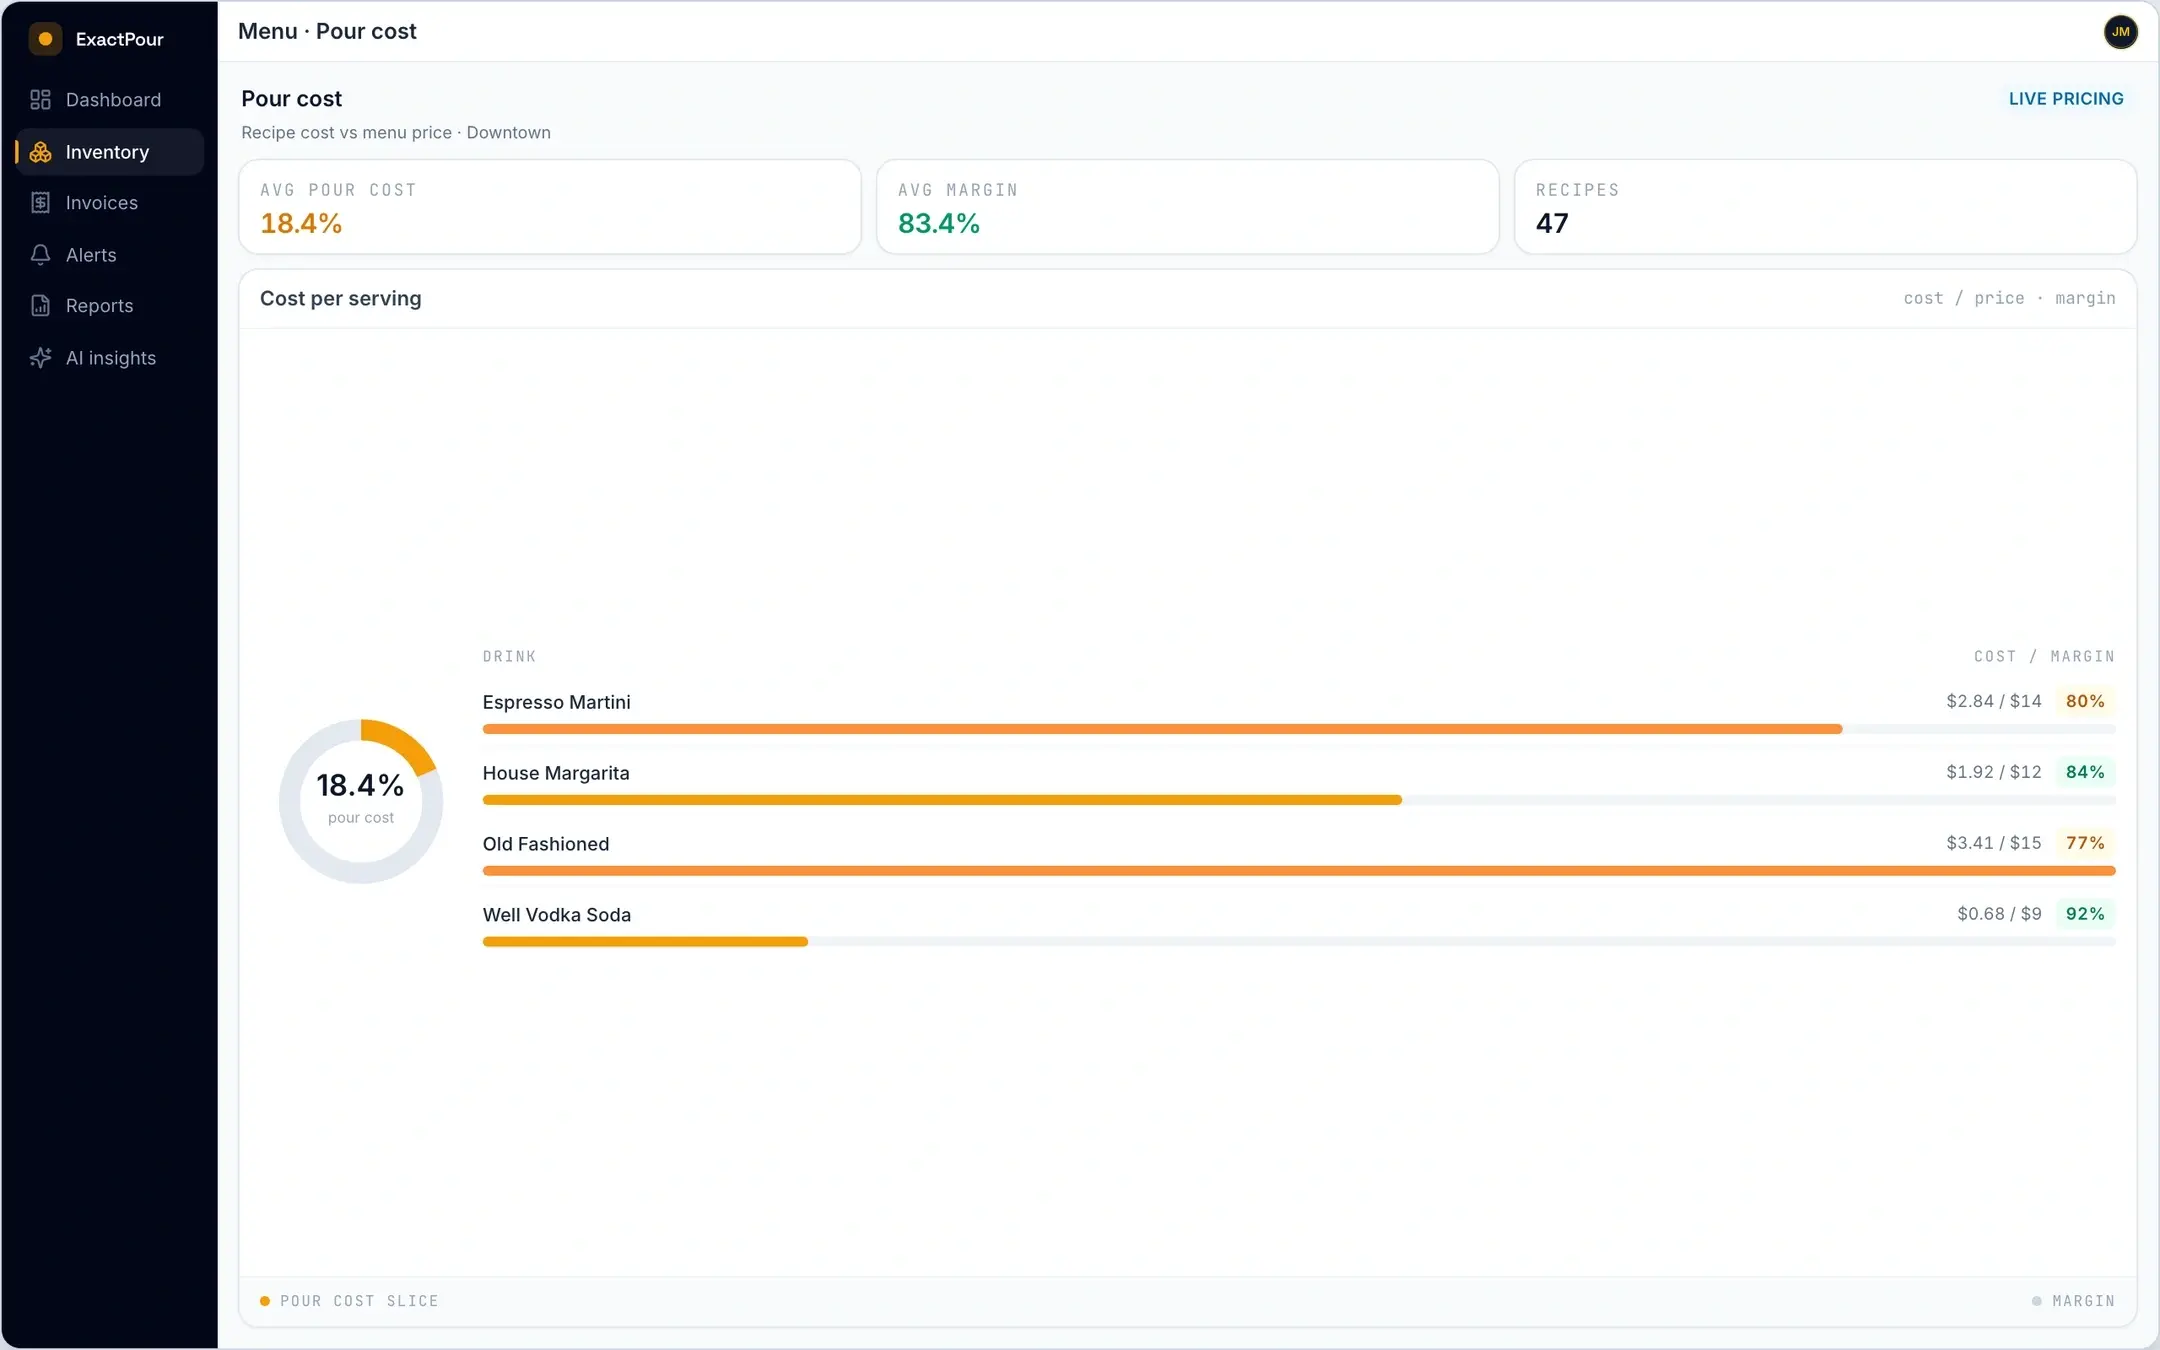
Pour cost is the percentage of revenue spent on the liquor in each drink. It is the headline metric of a healthy bar, and it is only as reliable as the inventory behind it.
Pour cost is the percentage of revenue spent on the liquor in each drink. If a cocktail sells for $14 and the liquor in it costs $2.10, the pour cost is 15% ($2.10 / $14). That single number is the headline metric of a healthy bar because it tells you, at a glance, whether your pricing and your recipes are aligned.
There is no universal target that fits every concept. A high-volume sports bar, a craft cocktail room, and a hotel lobby program can all be healthy at different pour-cost levels. Your useful target depends on product mix, pricing power, service model, and what the rest of the P&L needs the beverage program to contribute. Establish a baseline from your own data and investigate movement rather than copying an uncited industry benchmark.
Pour cost becomes unreliable when its inputs are stale. Old bottle prices, infrequent counts, and undocumented recipes can make a precise-looking result misleading. A spreadsheet that looks exact to two decimal places can still be wrong if last month's invoice prices never made it into the cost file, or if the recipe for a house gin & tonic still assumes a pour size the bar stopped using two menus ago.
The cleanest way to think about the math is as a chain of linked facts: what did you pay for the bottle, how many servings does that bottle yield at your specified pour, what is the ingredient cost of each recipe, and what did the guest pay. Break any link and the percentage still computes, it just stops meaning what you think it means.
Start with bottle cost. Cost per ounce (or milliliter) equals purchase price divided by usable volume. If a 750 ml bottle costs $24 and you treat the full volume as usable, cost per ounce is roughly $0.95. If you exclude a small heel that never pours cleanly, recalculate with that convention and keep it consistent across products. Consistency matters more than arguing about a few milliliters of heel.
Next, attach recipes. Every menu drink that uses liquor should list ingredients and pour sizes in the same units you use for cost. A vodka soda is simple; a multi-spirit cocktail is where silent drift appears. When bartenders freestyle garnish liquor, float a different amaro, or upsize a pour for regulars, projected cost and actual cost diverge even if the POS rings the same SKU.
Projected pour cost answers: given sales and recipes, what should ingredient cost have been? Actual pour cost answers: given starting inventory, receiving, and ending inventory, what did you actually use relative to beverage revenue? The gap between those two views is where variance analysis earns its keep. Pour cost and variance are related, but they are not the same report.
A practical weekly workflow looks like this. Keep bottle prices current from supplier invoices. Count on a cadence you can sustain, see our companion piece on count frequency, and the broader context in ExactPour's bar inventory software guide at bar inventory software. Close the period with a physical count. Pull POS sales for the same window. Compute projected usage from recipes, actual usage from the inventory identity, and pour cost from cost of liquor used divided by beverage sales. For a quick sanity check before you adopt software, use the free calculator at pour cost calculator.
Category rollups help you see structure without drowning in SKUs. Well spirits, call brands, premium bottles, wine, beer, and non-alcoholic programs often behave differently. A rising overall pour cost may be a pricing problem in one category and a receiving or waste problem in another. Product-level pour cost catches the cocktail that was underpriced when a base spirit jumped, or the pour that was never updated after a recipe change.
When a base spirit gets more expensive, do not wait for month-end to notice. Map which recipes use that SKU, estimate the new per-drink cost, and decide whether to adjust price, reformulate, switch brands, or accept a temporary margin hit. The operators who treat pour cost as a living input, not a quarterly autopsy, make smaller, faster corrections.
Comps, spills, and staff drinks complicate the story if they never leave the POS or waste log. If comps ring at zero revenue but still deplete inventory, they inflate pour cost unless you account for them deliberately. Decide whether your pour-cost report includes those events, document the rule, and apply it the same way every period so trends remain comparable.
Multi-location groups should compute pour cost per outlet before they roll up. A blended company number can hide a lounge that is pricing correctly and a high-volume bar that is not. Shared storage and transfers between outlets also need clear rules; otherwise one location's ending count becomes another's unexplained receiving.
Common failure modes include: updating menu prices without updating recipe costs; counting in different units than recipes; treating invoice credit memos as if they never happened; and comparing a busy holiday week to a slow shoulder week without context. None of these require bad intent, they only require inconsistent process.
ExactPour is built to keep the chain intact: barcode-driven counts, fill levels for partials, POS-linked projected usage, invoice OCR for current bottle costs, and pour-cost views by category, product, drink, and location. The software does not invent a universal target percentage for you; it makes your own number trustworthy enough to manage.
If you are evaluating tools, start from the buying criteria in bar inventory software rather than from a single dashboard screenshot. Ask whether recipes, counts, invoices, and sales share one catalog. Ask how partial bottles are recorded. Ask how quickly a price change flows into drink cost. Those questions matter more than any marketing claim about industry averages.
A useful two-week trial agenda: load your active liquor catalog and recipes, connect POS sales for a test location, run at least two full counts, process a real supplier invoice, and compare projected versus actual on a handful of high-velocity SKUs. If the workflow fits your team and the numbers match your intuition where they should, and surprise you where process was loose, you have a foundation for ongoing pour-cost control.
Pour cost will never be a perfect microscope. Estimation error on partials, timing around deliveries, and human judgment on waste codes all add noise. The goal is not zero noise. The goal is a signal stable enough that when the number moves, you know whether to look at pricing, recipes, pouring habits, or inventory integrity, and you can act in the same week the movement appears.
Document your pour-cost definition the same way you document recipes. Does the numerator include only liquor, or beer and wine as well? Does the denominator use beverage sales only, or total food-and-beverage? Mixed definitions make period-over-period charts look like strategy changes when they are only labeling changes. Write the definition once, train managers on it, and keep historical notes when you intentionally change scope.
Seasonality and daypart mix also move pour cost without anyone changing a recipe. A brunch-heavy week with bottomless mimosa promotions will not look like a Friday night whiskey program. Annotate known promotions on the same calendar you use for counts so a spike is interpreted in context. ExactPour cannot invent that context for you, but it can keep the underlying cost and usage numbers current enough that the annotation is about the business, not about data cleanup.
Supplier deals and temporary closeouts deserve a short-lived cost note. If you buy a one-time pallet at a discount, decide whether drink cost should reflect the deal price until that lot is gone, or a blended cost. Either approach can be valid; switching mid-lot without a note creates phantom pour-cost wins or losses. Invoice OCR helps you see the deal; your policy decides how it enters the recipe cost file.
Staff education closes the loop between finance and the rail. Bartenders do not need a full cost accounting course, but they should know which house pours are margin-sensitive and which substitutions require a manager. When pour cost is only discussed in an office after the P&L closes, the people who can fix free-pour drift never hear the number while it is still actionable.
Finally, treat pour cost as one instrument in a panel that also includes variance, sales mix, and labor. A falling pour cost driven by underportioning that drives guests away is not a win. A rising pour cost during a deliberate premiumization strategy may be acceptable if contribution dollars rise. The calculation keeps you honest; judgment still sets the strategy. Use bar inventory software as the map for the systems that keep those instruments in tune.
Build a simple monthly pour-cost packet for ownership even if the live tools update weekly. Include the definition, the category rollup, the top movers in dollar cost, any deliberate pricing experiments, and open data-quality issues. A short packet prevents the meeting from becoming a debate about whether the number is real. When the packet and the software agree, trust compounds; when they diverge, you have a concrete cleanup task.
International and craft-heavy programs should watch currency and allocation quirks on special orders. A one-off import priced differently than the house catalog can distort a single cocktail's cost if someone updates the wrong SKU. Keep special-order costs on the special-order item, not blended into the house bottle, unless you intentionally run a weighted cost blend and document it.
Keep a short glossary for your team: projected pour cost, actual pour cost, recipe cost, and bottle cost. When those four phrases mean the same thing to the GM, the beverage director, and the bartender lead, meetings get shorter. ExactPour can compute the figures; shared language is what turns the figures into decisions worth the time you spent counting.
Put it into practice
See this on your bar
Run ExactPour for two weeks and turn this guide into real numbers in your own operation. Book a walkthrough if you want a live tour first.
Related
Guides
How to count liquor inventory: a practical bar and retail workflow
Guides
How to choose bar inventory software without the demo fog
Guides
How to price a cocktail menu with pour-cost math
Guides
How to benchmark your bar's pour cost without folklore
Solutions
Pour cost control
Glossary
Pour cost percentage