
Project usage
Starting stock minus POS sales (through recipes) is what should be gone.
Solution
Variance is the difference between what you should have and what you do. ExactPour computes it per product, flags what's beyond tolerance, and lets you reconcile each gap with a reason so loss stops being a mystery.
14 days free · No credit card · Plans from $59/month
Last updated
Liquor variance analysis compares projected inventory (what should be left after sales) against the actual physical count to reveal loss from over-pouring, theft, breakage, or measurement error. ExactPour computes variance per product, flags anything beyond tolerance (over 10% warning, over 5% info), and lets you reconcile each gap with a reason code and notes.
Starting stock minus POS sales (through recipes) is what should be gone.
The physical session closes the loop. The gap is variance in ounces and dollars.
Reason codes separate breakage, comps, and over-pours from what is still unexplained.
The problem
A shrinking bottle count tells you there's a problem but nothing about whether it's theft, waste, or a heavy pour.
Without computing what should be on the shelf, there's nothing to measure the actual count against.
Even when you spot a gap, there's no place to record the reason, so patterns never emerge.
The solution
The projected engine plus reason-coded reconciliation and anomaly detection.
The baseline behind every comparison.
For every product, ExactPour computes what should be on the shelf from starting bottles minus what the POS says you sold. This is the engine that powers poured-vs-sold comparisons.
Surface the gaps. Explain them.
Items that drift beyond tolerance are flagged (>10% warning, >5% info). Close each out with a reason (breakage, theft, over-pour, measurement error) and notes.
Catch outliers the moment they appear.
Learns each product's normal range from 90 days of history and flags it when the latest numbers break pattern. Runs on demand and nightly.
Document every dropped bottle.
Log breakage, spillage, comps, spoilage, expiry, theft, and training with quantity, volume, cost, and notes. Used as evidence when reconciling variance.
Wake up to what needs fixing.
Auto-generates 3 to 5 prioritized, actionable insights from the last 30 days of variance, sales, and counts, each carrying a severity so you know what to act on first.
Toast, Square, Clover, and GoTab are live.
Connect Toast, Square, Clover, or GoTab to a location. Menus and sales import on a schedule or when you ask. POS credentials are stored encrypted.
Integrates with the POS you already run
Sales sync nightly · No rip and replace




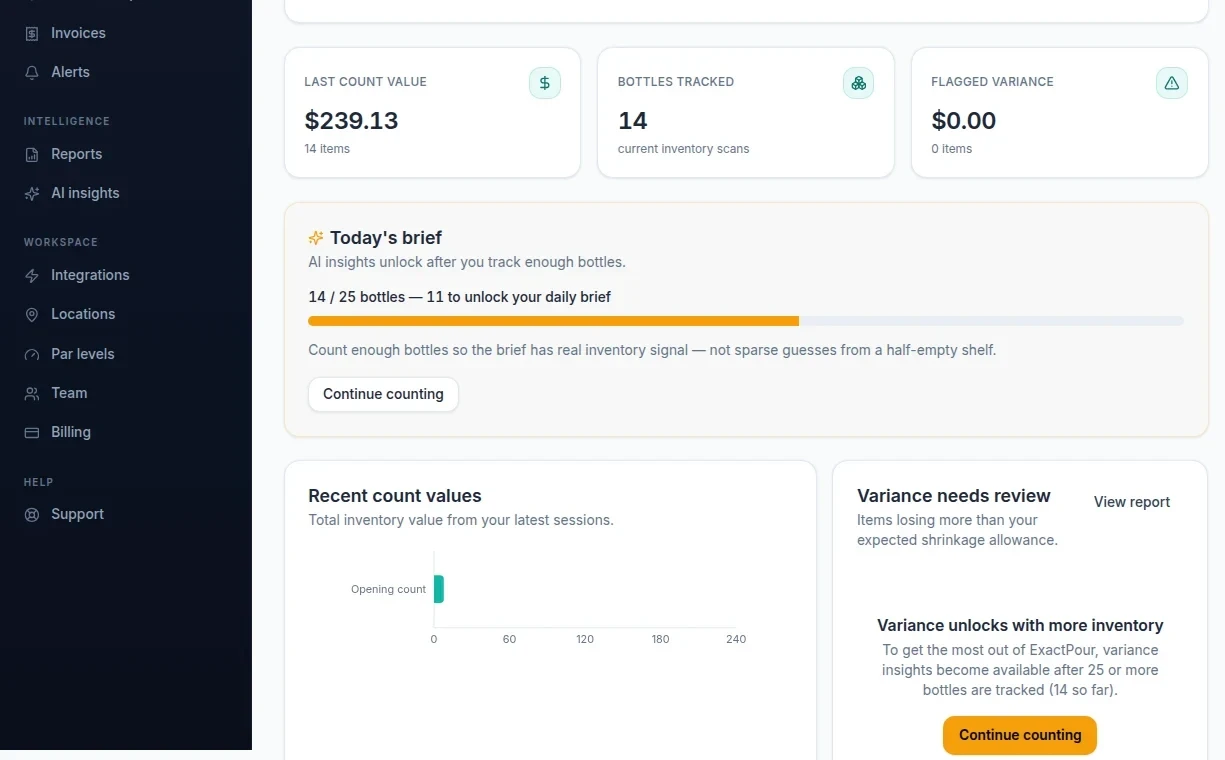
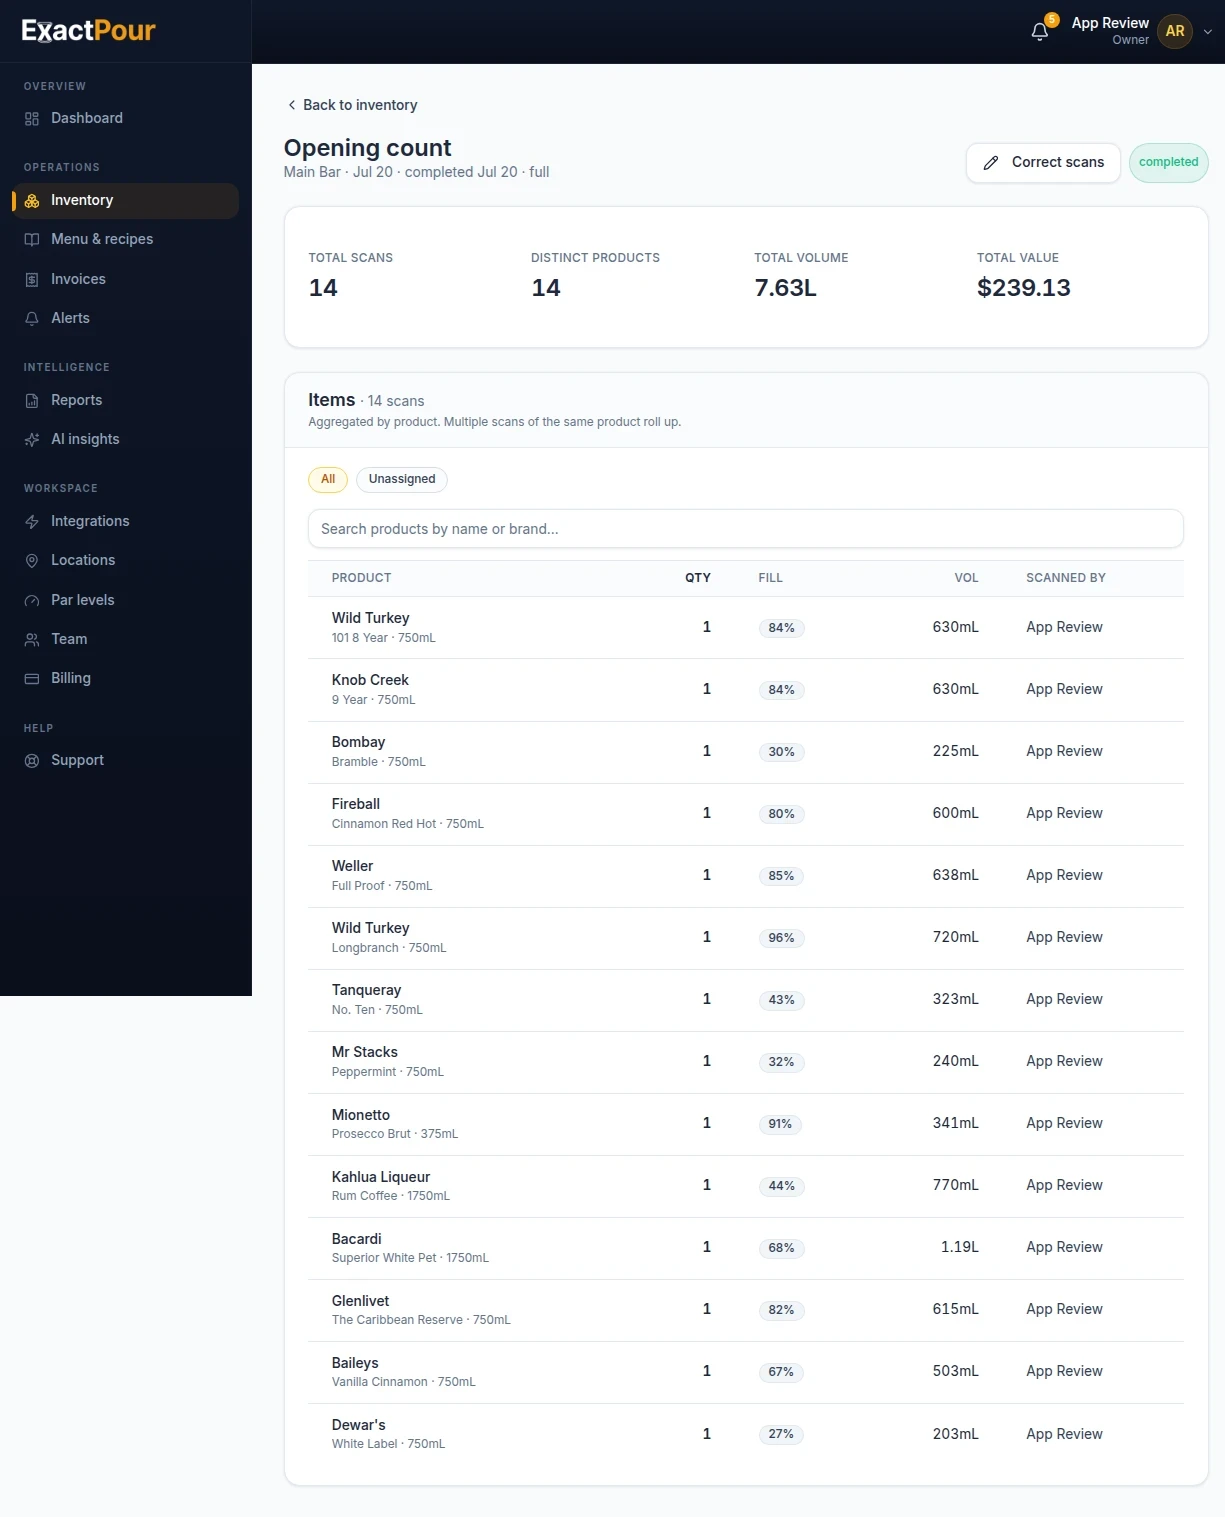
Dashboard variance after a real count
demo workspace: $0.00 flagged variance on 14 counted items. Your room will show its own dollars.
Compare
| Capability | ExactPour | Manual variance check |
|---|---|---|
| Projected inventory | Computed automatically | Built by hand |
| Outliers surfaced | Flagged beyond tolerance | Eyeballed |
| Reason-coded reconciliation | ||
| Variance history & trends | ||
| Per-shift & per-product drill-down | ||
| Evidence to coach staff | Documented | He-said-she-said |
Compute projected inventory per product automatically
Flag variance beyond your tolerance thresholds
Reconcile each gap with a reason code and notes
Detect statistical anomalies against a 90-day baseline
Turn documented reasons into trend insights
Liquor variance analysis asks whether the difference between expected and actual inventory needs review. Variance is the gap between projected inventory, your starting stock minus POS-derived usage, and the physical shelf count. inventory variance is the definition. A persistent variance can point to over-pouring, comps, unrecorded waste, theft, transfers, or measurement error, but the number alone does not prove a cause.
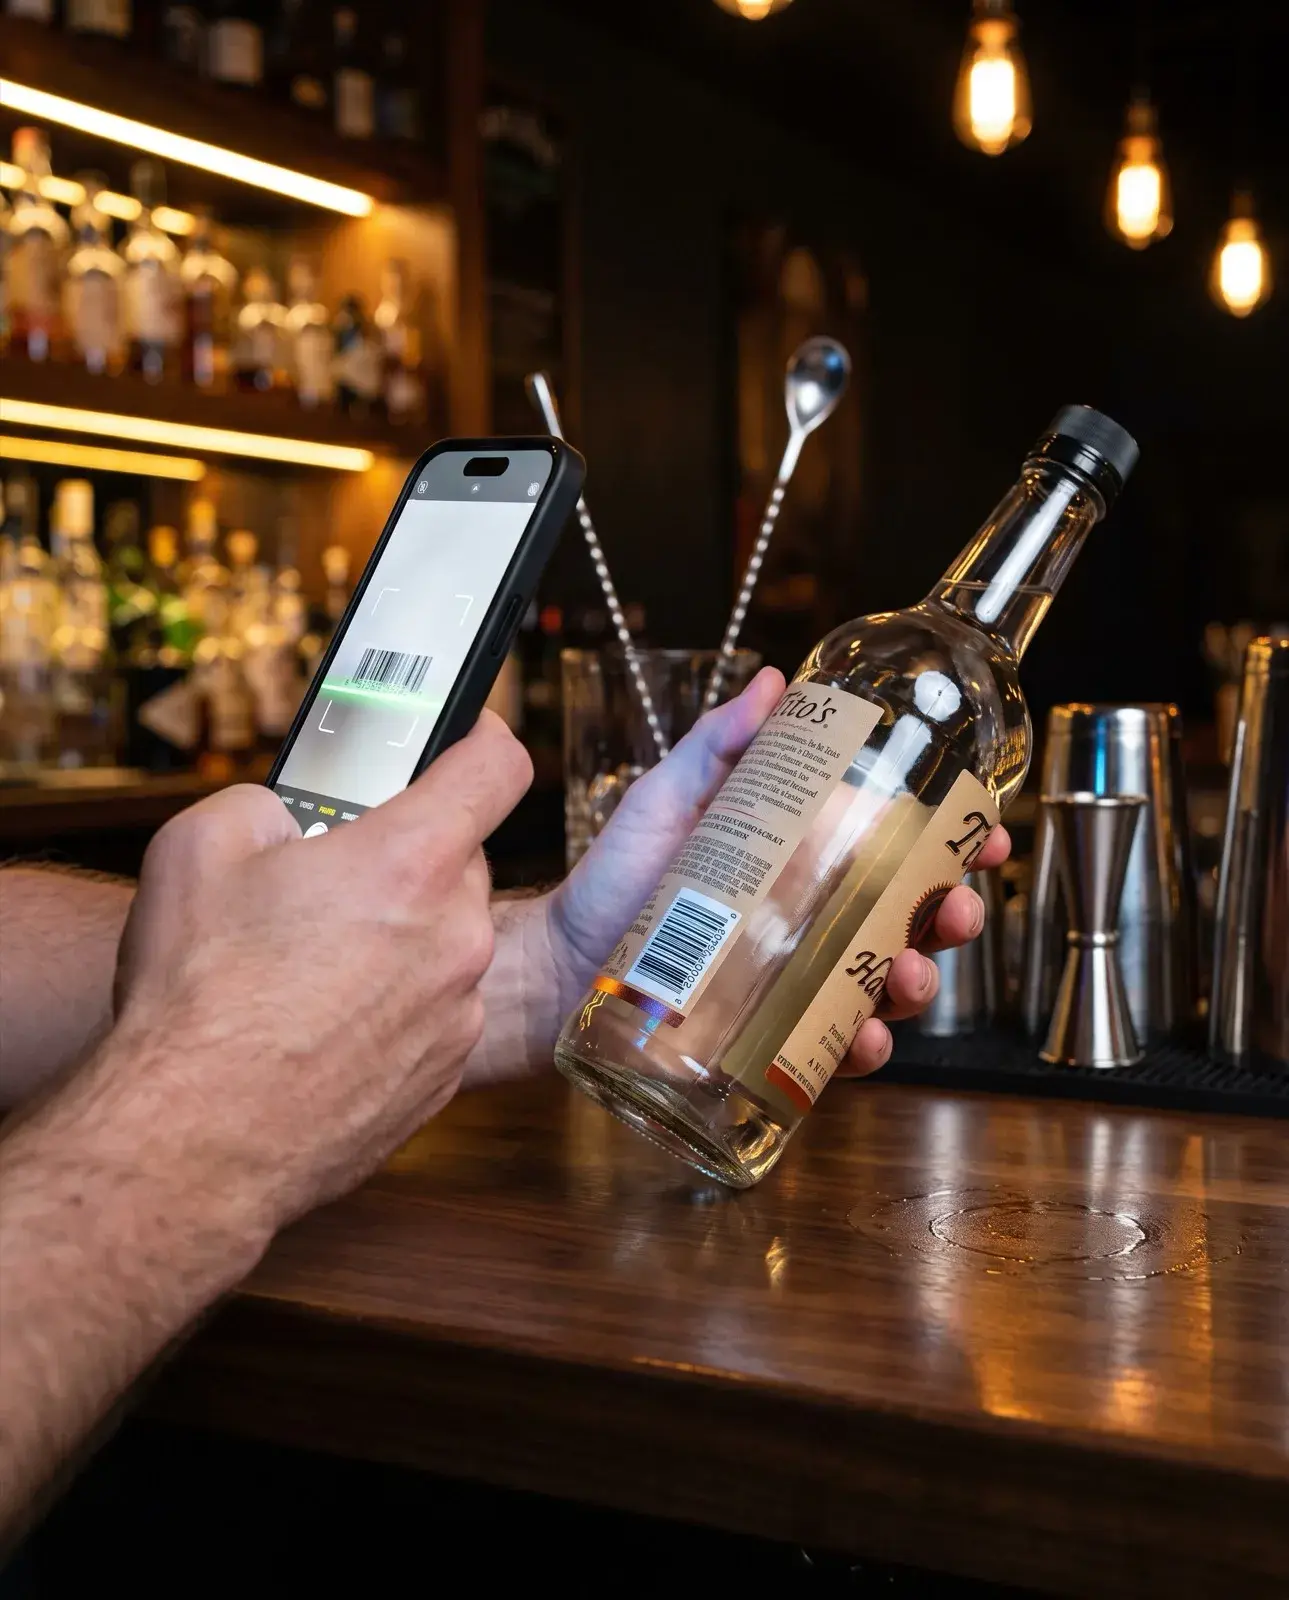
The trouble is that most operators never compute variance at all, because doing it by hand requires an accurate count, clean sales data, and recipes that map every drink to the liquor it consumes. ExactPour assembles all three automatically. It pulls sales from your POS, applies your recipes, computes projected usage, and compares it against your barcode count to produce a variance figure for every product. Instead of a gut feeling, you get a bar variance report that shows projected versus actual inventory line by line, in units and in dollars.
The heart of variance analysis is the comparison of projected versus actual inventory. Projected is what the math says you should have; actual is what you counted. When actual is lower than projected, product left without a corresponding sale, the classic shrinkage signature. When actual is higher, you may be under-pouring, mis-ringing, or your recipes may overstate usage. Both directions are information. ExactPour presents the gap as a percentage and a dollar value per product, so a two-percent variance on cheap well vodka gets less attention than a two-percent variance on a premium bottle that represents real money.
Reading variance well means understanding tolerance. Not every gap deserves a manager's time, so ExactPour lets you set a tolerance threshold and flags only the products that drift beyond it. That focus is what makes liquor cost variance actionable rather than overwhelming. Instead of scanning a spreadsheet of hundreds of SKUs, you get a short list of the products that actually matter this cycle, ranked by impact, so your investigation time goes where it recovers the most margin.
A variance number alone does not fix anything; the value comes from explaining it. ExactPour lets you reconcile each flagged gap with a reason code, breakage, over-pour, spill, comp, or an honest measurement error, so every discrepancy gets an explanation attached to it. This does two things. First, it separates the unavoidable operational loss every bar incurs from the patterns that signal a real problem. Second, it builds a documented history you can stand behind when you coach a bartender or answer an owner's question about where the money went.
Over several cycles, that reason-coded history becomes a powerful management asset. You can see that a particular well spirit always runs short, that one shift consistently posts worse variance than the others, or that a specific SKU disappears faster than sales can explain. These are conversations grounded in evidence rather than suspicion, which is exactly what makes staff take them seriously. An inventory variance software that captures the why, not just the what, turns variance from an accusation into a coaching tool and a deterrent.
In a busy bar, some variance patterns are too subtle for a human to catch by eye. A product that runs three percent short every week is easy to normalize as just how it goes, even though it is quietly costing you real money. ExactPour's AI layer builds a statistical baseline for each product over time and flags any item whose variance jumps beyond its normal range, so anomalies surface automatically instead of hiding inside routine noise. It is the difference between reviewing a report and having a report review itself.
This matters most for high-volume operations, where sheer throughput buries individual leaks. Anomaly detection watches variance across products, shifts, and locations and routes the outliers that deserve attention to the top, backed by the underlying counts and sales. Because the analysis runs continuously, you catch a problem that started this week rather than discovering it at a quarterly review after the damage is done. For loss prevention, that early, data-driven warning is often the most valuable output of the entire variance analysis process.
The ultimate goal of liquor variance analysis is not a tidy report; it is a beverage program where variance trends down and stays down. That happens when measurement is frequent, explanations are documented, and staff know pours are watched. ExactPour makes frequency possible by pairing fast barcode counting with automatic reconciliation, so a manager can run a variance report weekly instead of quarterly. More frequent analysis means problems are caught while the trail is still warm and correctable.
Getting started is straightforward: scan your shelves to build the product list, connect your POS, set your recipes and tolerance thresholds, and run your first reconciliation, typically within a day. From there, each cycle sharpens the picture, and the reason-coded history compounds into a clear map of where your margin leaks and how well your fixes are working. Bars that treat variance analysis as an ongoing discipline rather than an occasional audit consistently recover margin that used to vanish unexplained, turning the variance report from a source of anxiety into a scoreboard for improvement.
Liquor variance is the difference between the product your sales say you should have used and the product you actually used. Calculating it follows a clear sequence: start with your opening inventory, add everything you purchased during the period, then subtract your closing physical count to get actual usage. Separately, take the sales from your point of sale, map each drink to the liquor it consumes through your recipes, and sum that to get projected usage. Variance is the gap between the two, expressed in volume, in dollars, or as a percentage of expected usage.
Each input has to be right or the whole number lies. Opening and closing counts must capture partial bottles at real fill levels, purchases must reflect what actually arrived, and recipes must match what bartenders truly pour. ExactPour automates the entire chain: barcode counts feed opening and closing inventory, invoice capture handles purchases, POS integration and recipes generate projected usage, and the platform computes variance for you by product, category, and location. What is a painful, error-prone spreadsheet exercise done by hand becomes a reliable number produced every cycle.
Not every variance deserves an investigation. Every bar has some unavoidable, honest loss, a little spillage, the occasional legitimate comp, so a tiny variance on most products is normal and chasing it wastes everyone's time. The skill is in setting tolerances: the threshold beyond which a gap stops being noise and starts being a signal. ExactPour lets you flag variance that exceeds tolerance automatically, so instead of scanning a spreadsheet of every product, you see only the handful that genuinely need attention.
Sensible tolerances also depend on the product. A high-volume well spirit might warrant a tighter percentage tolerance because small over-pours multiply fast, while a rarely poured premium bottle warrants a tight dollar tolerance because a single missing unit is expensive. By tuning thresholds to how each product behaves, you focus your energy where the money actually is. That targeting is what makes variance analysis sustainable, managers act on a short, meaningful list of exceptions rather than drowning in data and eventually ignoring it altogether.
Variance becomes actionable when you can slice it. Product-level variance points at a specific bottle that is consistently short, often the fingerprint of over-pouring a particular well spirit or a popular call brand. Category-level variance tells you whether the problem is concentrated in spirits, wine, or beer, each of which has different likely causes. Location-level variance, for groups, reveals which venue is out of line with the rest and deserves a closer look.
ExactPour surfaces all three views from the same reconciled data, so a pattern that would be invisible in a single blended number becomes obvious. A spirit that runs short only on weekend shifts, a wine category losing more than spoilage can explain, a location whose variance dwarfs its peers, each is a lead you can act on. Reading variance across these dimensions over several cycles turns scattered anomalies into a clear map of where your product and margin are leaking and who or what is behind it.
Variance analysis only changes outcomes if it changes behavior, and that happens in a regular review, not a spreadsheet nobody opens. The most effective operators run a short, consistent variance review each cycle: look at the flagged exceptions, assign a reason to each, and decide on an action, coach a heavy pourer, correct a misring, tighten a recipe, or investigate a genuine loss. ExactPour supports that rhythm with reason-coded reconciliation and a clear record of who counted what and when, so the meeting works from evidence rather than accusation.
The cultural effect compounds. When staff know variance is reviewed every week and that the numbers are accurate, over-pouring and casual comps decline simply because everyone understands they are being measured. The review stops feeling like a witch hunt and becomes a normal part of running a tight program, one where honest loss is documented, real problems are addressed early, and the whole team shares a clear picture of the margin they are collectively protecting. That discipline, more than any single catch, is what turns variance analysis into lasting margin gains.
FAQ
ExactPour computes projected inventory as starting stock minus POS-reported sales, then subtracts your actual physical count. The difference is variance, expressed per product in volume and value.
There is no universal acceptable variance. Set a threshold that fits your operation and investigate movement against your own baseline. ExactPour provides configurable review thresholds and reason-coded reconciliation.
Variance flags use fixed tolerance thresholds, while anomaly detection builds a per-product statistical baseline over 90 days and flags items whose latest variance exceeds two standard deviations.
Yes. Every flagged item can be reconciled with a reason code (breakage, theft, over-pour, or measurement error) plus notes, building a history you can analyze.
Next step
Start your 14-day Pro trial. No credit card required.
Start tonight
Run ExactPour on your own bar for two weeks. See the leaks, the over-pours, and the dollars you can still save.
14 days free · No credit card · From $59/mo